Author: Jerry Lee
The main difference between observability and legacy monitoring solutions is to minimize service interruption due to failure by identifying root-cause beyond receiving system alerts and providing a dashboard. For this purpose, efforts are being made to provide more diverse information and solutions. For example, the number of exporters registered on GitHub is over 10,000, and the number of dashboards registered in Grafana is over 2,000.
In particular, as development based on cloud-native technology is gaining popularity, log & tracing, which identifies which section causes problems in the complex application interworking of the microservice architecture structure, is also attracting attention. Grafana recently released the improved Tempo, and CNCF designated OpenTelemetry as the standard protocol for collecting trace data. In addition, it is clear that observability-specialized solutions focusing on traceability, such as Honeycomb.io, are also appearing in the market, and that it is evolving toward the original purpose of observability – that is, to identify the cause of an incident and provide a prompt solution.
On the other hand, DevOps Engineers or System Operators need to understand more dashboards, metrics, SLI/SLO, etc. In addition, the reality is that continuous learning and investment must be carried out. It may still be difficult to quickly respond to failures when a lot of information is reconstructed based on incidents and an empirical understanding of it is accompanied. The concept that emerged for this purpose is AIOps.
AIOps uses artificial intelligence to simplify IT operations management and accelerate and automate problem resolution in complex modern IT environments (source: https://www.ibm.com/cloud/learn/aiops). In order to actually use AIOps, it is necessary to collect and analyze vast and ever-increasing data collected from various IT infrastructure components, applications, performance monitoring tools, etc., and to find meaningful events and patterns that can cause failure. In addition, the purpose is to find the root-cause of this and to suggest a quick solution or to solve a specific problem automatically.
From this point of view, NexClipper has collaborated with several users to collect system log and metric data, and has performed prototyping to predict failures using an ML platform. The lesson learned in this process is that it is not easy to get meaningful results unless you have massive data for the ML platform to learn the incident case-by-case and suggest solutions. In addition, even SaaS-based observability platform providers who have a lot of customer data are judged to have a lot of trial and error before they can provide AIOps services that reach this level.
If this is the case, what kind of solution is there to provide a service similar to AIOps in the currently available technology environment? This article proposes a solution idea for this and seeks to hear the opinions of the observability community.
Where are we now?
The figure below shows an example of a company that has implemented a CI/CD system. Actual systems can be much more complex than this. It is easy to find companies with different CI/CD systems for each system, and standardizing such a distributed environment will be a task that many companies have.
Nevertheless, various information generated in the CI/CD system can be usefully utilized when integrated and managed. A typical example is to identify the root-cause of an incident. When an incident occurs, it is not easy to determine the cause. However, there is actually a lot of information that can help you identify the root-cause.
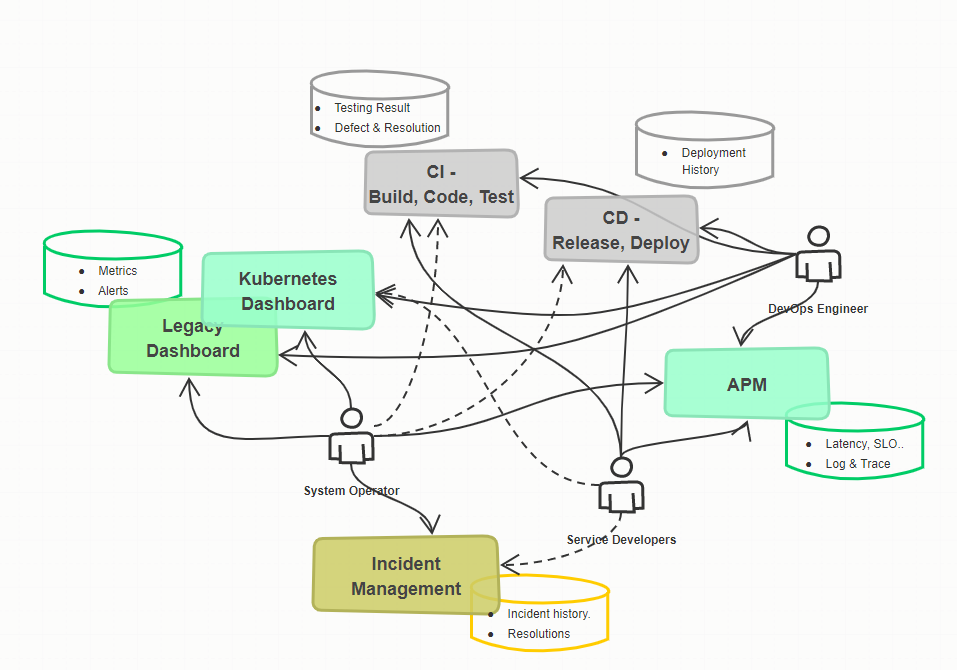
The most basic action to identify the cause of an incident is to check the basic metrics of the node or service where the incident occurred through the dashboard and estimate the cause of the incident. When a detailed analysis of the application is required, analysis is performed on the log or trace on the microservice through collaboration with the application developer.
A failure in a specific node or pod requires a procedure to check what deployment or provisioning has been performed on the corresponding node/pod, and this information can be found in the CD-related system. Rolling back a deployed release through this is a common incident resolution method.
In addition, test results and resolution actions on CI are also unexpected sources of information. Incidents similar to those that occurred during development often occur in the production environment. Therefore, the root-cause analysis result in the test stage can help determine whether rollback is necessary or whether it can be solved with urgent operational resolution.
Similar incident and resolution history can be inquired through the incident management system, but if meta data of the incident is not well structured, it may be difficult to use effectively for incident resolution. Also, if reference metrics or resolution actions are not attached well, it may be difficult to find help based on the incident history.
The content mentioned above will be common sense for most experienced operation managers to check. However, these activities are time-consuming and sometimes the necessary information may not be available. In particular, there is a high possibility that the metrics or log information of similar events that have occurred in the past have already been deleted unless stored separately. Operation managers mostly depend on developers for testing information from the development stage, and it is not easy to relate this to incident resolution activity.
If this is the case, how about re-listing and managing this data from the viewpoint of observability? That is, information such as incident & resolution, alert, metric, deployment, provisioning, testing, and log & trace is related to hierarchical information such as specific cluster, node, and service in a mind-map method.
Structuring CI/CD information from the viewpoint of observability
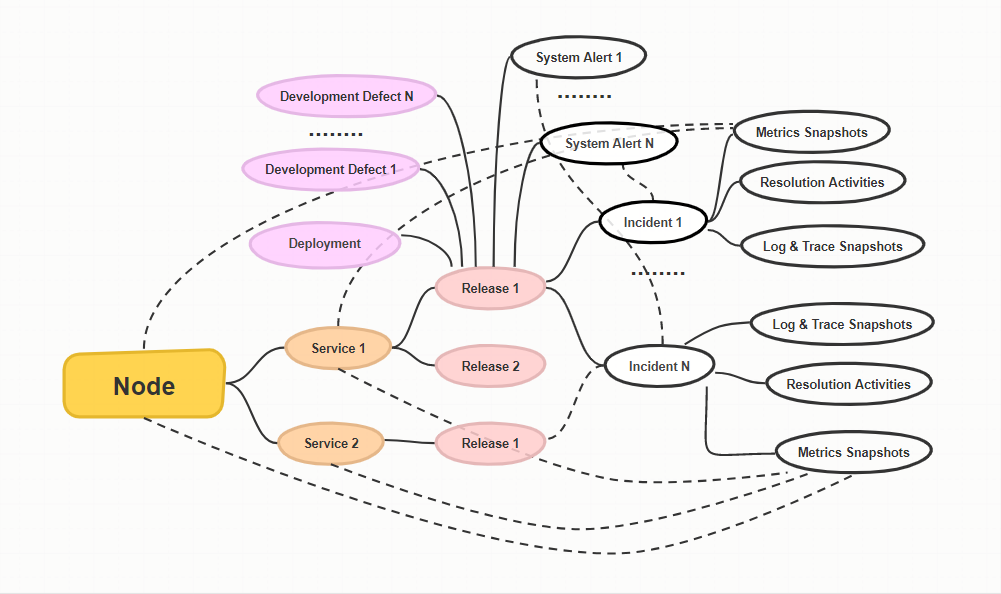
If various information generated from CI/CD can be organized and viewed like the map above, it will be useful to identify the root-cause of the incident. That is, incidents occurring in a specific node can be easily resolved by comprehensively reviewing the incidents history, alerts, logs, provision, and metrics information of the node.
Incidents that occurred in a specific release of microservices can also be easily resolved by comprehensively reviewing incident history, alerts, logs & traces, testings, and deployment information.
I think that the comprehensive provision of such related information will not only help a lot in responding to failures quickly when an incident occurs, but also help the system automatically respond to specific failures through the rule database.
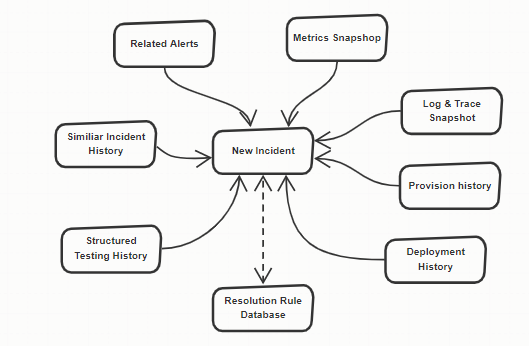
For suggesting the resolution of incidents, a resolution rule database needs to be set up with “Incident Type”, “Symptom”, “Thresholds of Causes” and “Suggested Resolution” so that all the collected information can be used to provide the resolution options to resolve the incident.
The information from the previous testing results and similar incident history need to be structured and input to the rule database. Under the environment, a system operator can create an incident and, associated with the information from CI/CD platform, the incident can refer to the rule database to get resolution options.
Figure
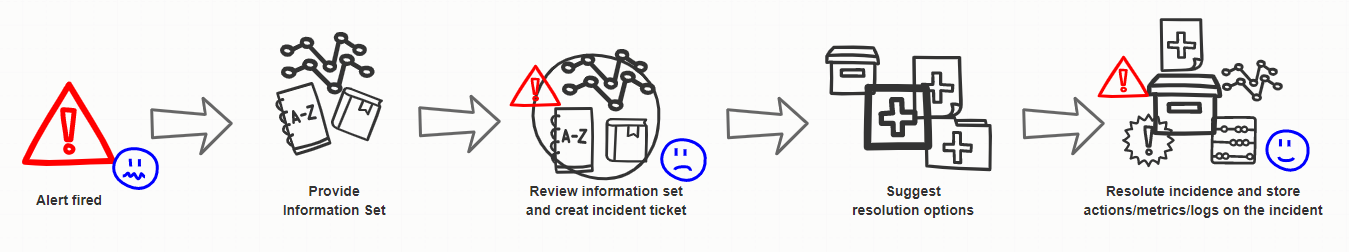
The incident resolution process in such an environment would be as follows.
Figure.
We see this as a transitional step towards AI/ML Ops and a realistic alternative worth trying. I’d like to hear the opinions of our readers on this.