InfluxData has been operating InfluxDB Cloud for over a year now. During that time, our SRE team and our Deployments team have been focused on continuous improvement of how we deploy and manage this stateful application.
We decided early on to use Kubernetes for InfluxDB Cloud, as Kubernetes provided the kind of abstraction layer that we needed to run at scale. For us, running at scale means running in multiple regions, available in multiple public clouds, and having the ability to provide private instances.
This kind of scale is important because InfluxDB is a database at its heart, and “data has gravity.” Users typically do not want to copy terabytes of data between regions, much less between cloud providers. Therefore, the more places we can run, the more users can use our service.
We have implemented a GitOps workflow in order to manage all of these instances. Though InfluxDB is used by many customers to monitor their Kubernetes infrastructure and applications running there, InfluxData is not a Kubernetes tooling company. We prefer to adopt and contribute to upstream tooling rather than to maintain custom tooling whenever possible. The tools that we use include:
- Argo
- Argo Workflow
- Jsonnet
- Kubecfg
There is a fair amount of custom code that we had to write to glue these components together, however.
Currently, on a typical workday, we deploy 2 to 5 times.
Signifiers of GitOps
Different people define “GitOps” differently. GitOps is not necessarily one way of doing things or one set of tools. For us, a team is using GitOps if the following three things are true:
- Developers get code into production by landing it in the main branch, and then automation takes care of moving the code to production.
- Infrastructure as code is delivered to production in the same automated manner as application code.
- Developers test in production.
Idealized view of our pipeline
Our approach is to deploy in waves, and to use an automated feedback loop to block between waves of deployment. Below is an idealized view of our overall pipeline.
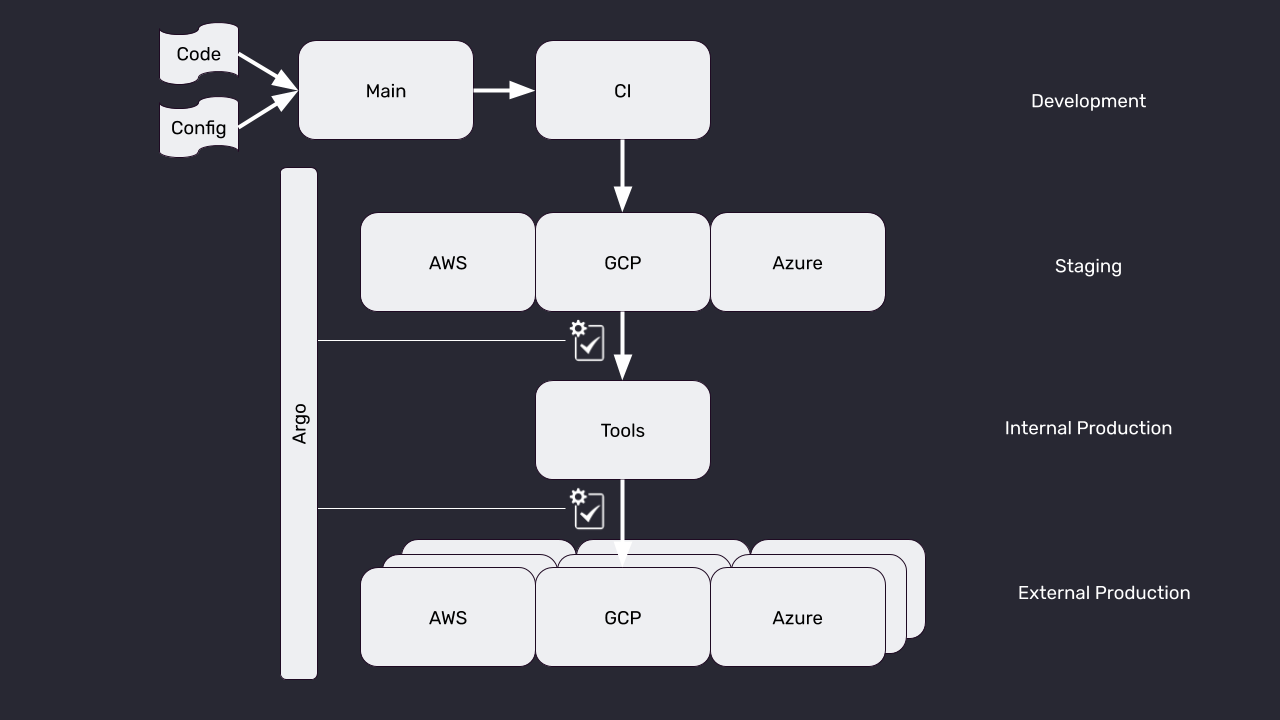
Development
In the development phase, developers author code in their development environment. When they believe the code is ready for deployment, they submit it through our CI system. If the code passes CI, then the new containers are built, and the CI system automatically updates the Kubernetes configuration code (jsonnet in our case) to point to the new container image through an automated pull request to the configuration repository. At that point, Argo notices that the repository has been updated, and a deployment is now underway.
Staging
We maintain small staging environments on each of the three public clouds we support. Argo deploys to these environments, and then kicks off a small set of tests to ensure that the deployment succeeded. Only if the tests succeed does the deployment proceed to the next wave. This wave of deployment is fast and lightweight, and is meant mostly as a sanity check.
We continue to have internal discussions about the utility of the Staging wave. Some engineers believe that it provides a valuable safety check. Others believe that it provides a false sense of security because the staging environments are not configured exactly like production, nor do they receive production traffic.
Internal Production
InfluxData maintains an internal instance of InfluxDB that we colloquially call “tools” for historical reasons, but is more formally known as “Internal Production.” It is Internal Production because, on the one hand, it is only accessible to InfluxData engineers, but on the other hand, we use it for true mission-critical use cases. We treat problems in tools as full-blown production incidents.
Again, after Argo deploys to Internal Production, we run a battery of tests before we go to the final wave.
External Production
These are the production environments that our end users use. We do, in fact, run automated tests after deployments even though those tests obviously do not gate deployments. Currently, all of our external production environments are updated concurrently.
Monitoring and feature flags
In addition to testing, of course our environments are constantly monitored. Aside from monitoring for standard operation parameters, we also build custom monitoring to keep an eye on how new features are impacting operations. We are heavy users of feature flags, and will often turn a feature on production, observe the impact, and then turn off the feature. Therefore, developers have a strong incentive to think about how they will monitor a feature before they make a PR to get it deployed.
Required elements for GitOps
From an engineering management perspective, the following requirements must be met for successful GitOps usage:
- A CI system that is able to build artifacts (containers in our case) and run tests on the code and artifacts.
- A way to represent your infrastructure as code, and a way to automatically update that code as a result of CI runs. We use Jsonnet in conjunction with kubecfg for this.
- A way to deploy when a change to the infrastructure code is detected. We use Argo for this.
- Feature flagging to allow developers to keep code flowing to the main branch and to test safely in production.
- Production metrics and reliable alerts. If you have code constantly flowing to production, you need to know if something is wrong. Without a reliable set of alerts, developers will lack the confidence to deploy often. Obviously, we use InfluxDB Cloud itself for this.
Fulfilling each of these requirements is an effort in and of itself. However, each independently will improve the quality of life for your engineering team, so they are certainly worth the effort if you have not already achieved such status with your team.
Optional elements
We found the following, while not required, were extremely useful additions to our GitOps workflow:
- When we first switched to CD via GitOps, we did not have an automated way to gate deployments between waves. We got significant value simply out of moving to a fully automated process, that we found that our rate of difficulties in production decreased dramatically anyway. Additionally, the fact that the deployments were automated meant that every environment was running the same code as in the main branch, which simplified troubleshooting dramatically.
- A pipeline for operations that sit above the deployments themselves. For example, gating based on an automated feedback loop. We use Argo Workflow for this.
- Feature flagging service. When we first started feature flagging, each developer implemented custom feature flagging for the code that they were writing. However, we have since migrated to a feature flagging service, and embed their client in our code. This allows anyone, including Product Managers, to enable and disable feature- flagged service through an easy-to-use GUI.
- Dashboards that provide at-a-glance metrics on system health help with developer confidence in their deploys. However, beware of the “humans staring at screens” anti-pattern. Dashboards are optional; it’s alerts that are required.
Benefits of adopting GitOps
Since we have gone all-in on GitOps, we are managing many more External Production environments, but we are also experiencing much less drama and effort-related deployments. To summarize the benefits:
- We have experienced a dramatic decrease in time working on releases. Developers get their code into the main branch following a similar process to before, and then their work in the deployment is over.
- We now experience much fewer, and much less severe, production incidents. This seems to be due to two things. First, the automated deployments remove the element of human error during a deploy. Second, because deployments are so much easier, teams deploy much more frequently. These more frequent and smaller deployments are much less likely to cause issues in production.
- Adding a new region is hardly any additional work, because everything is code.
- Finally, all of our production environments are always running the same code, and it is the code that is in the main branch. This consistency makes reasoning about the state of production so much easier, that we avoid many problems, and can much more quickly solve problems.
Conclusion
By adopting a GitOps workflow, InfluxData has been able to scale to running a mission-critical production service on Kubernetes in multiple regions on multiple clouds, while decreasing our effort and down time, and increasing our velocity and developer happiness.
To learn more about InfluxData, visit our website or download the open source version of InfluxDB.
To learn more about containerized infrastructure and cloud native technologies, consider joining us at KubeCon + CloudNativeCon NA Virtual, November 17-20.