
Author: Rob Skillington
For the past few years Prometheus has solved the monitoring needs of many and it is exceptional at what it does. Being the second project to graduate from CNCF incubation, Prometheus has exploded in popularity and is the monitoring tool of choice for many cloud native adopters. While Prometheus is great at real time monitoring, it was not designed to be a long term persistent store of metrics.
M3 is an open source metrics platform that integrates with Prometheus and provides long term persistent storage of metrics with high reliability. Developed at Uber, the M3 platform has been proven to scale in production to handle hundreds of millions of writes per second and store billions of metrics. While the platform can scale to handle even the largest of workloads, it’s deployment and operational management remains simple as it runs on Kubernetes, which can be managed by a Kubernetes operator and setup with Helm and Terraform modules.
Architecture
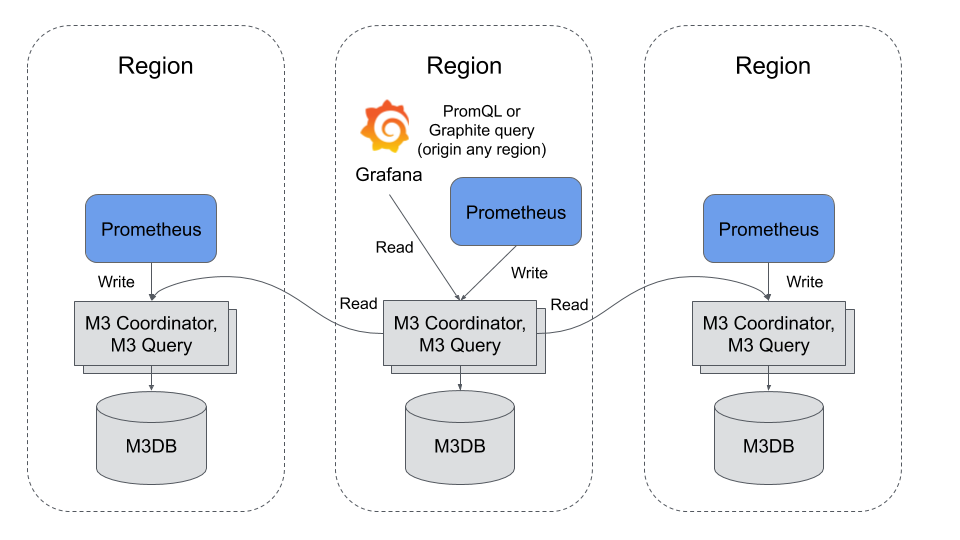
The architecture of the M3 platform consists of three main components:
- M3 Coordinator is a sidecar process that runs alongside an existing Prometheus instance. It serves two purposes: to aggregate metrics into configurable resolutions and forward metrics to the appropriate storage nodes.
- M3DB is a distributed time series database. Written in Go without CGO, it was designed and built to fulfill the performance, reliability and scalability requirements that Uber required for a metrics platform.
- M3 Query is a service that was designed to allow M3 to query billions of datapoints per second. In addition to supporting the Prometheus remote read endpoint, it also supports serving PromQL queries directly and integrates with Grafana and Prometheus Alert Manager. The query engine gives a single pane of glass to all of your metrics, as it can be connected to other M3 query instances in other datacenters and return an aggregate view of metrics globally.
Operating M3
The simplest way to run the M3 platform is on Kubernetes with the Kubernetes operator. The M3 platform was one of the first large scale stateful systems to leverage Kubernetes Local Persistent Volumes and you can find out more about the operator by watching the M3 operator keynote, presented at KubeCon North America 2018 in Seattle.
Using kubectl, you can install the bundled operator manifests in the current namespace:
kubectl apply -f
https://raw.githubusercontent.com/m3db/m3db-operator/master/bundle.yaml
Alternatively, using Helm
Add the m3db-operator repo:
helm repo add m3db

https://s3.amazonaws.com/m3-helm-charts-repository/stable
Install the m3db-operator chart:
helm install m3db/m3db-operator --namespace m3db-operator
Creating a cluster
After creation of the resources, a cluster can be created by following the getting started documentation. The M3 operator will automate maintenance and operational tasks such as:
- Creation of M3DB clusters
- Tear down of M3DB clusters
- Expanding clusters (adding instances)
- Shrinking clusters (removing instances)
- Replacing failed instances
Alternatives to the Kubernetes operator
If you have requirements that are not met by the operator, you can follow operational steps by hand to set up M3 on Kubernetes or use the M3 Terraform module. Finally, if you want to use M3 outside the context of Kubernetes, that is possible too with the guide for creating a cluster on VMs or bare metal.
Supporting New and Old
Uber, like many companies who have been around for more than a few years, had a legacy monitoring system prior to M3. It was based on the flat metric exposition formats of Stastd and Carbon and leveraged the Graphite query language. Even though most new applications are emitting metrics in the new tagged metric exposition formats like Prometheus and leveraging tagged query languages like PromQL, the full migration would be a multi-year effort and Uber didn’t want to support two metric platforms. This is why M3 added support for flat metric exposition formats like Statsd and Carbon and the Graphite query language.
This means with M3 an organization can support both new and legacy applications, emitting metrics in different formats using the same storage and aggregation infrastructure, and query them using the applicable query language based on the application (PromQL or Graphite). There is no need to set up separate clusters for each format, these different metric types are stored next to each other in the same storage nodes, avoiding the need for a painful big bang multi-year migration. Read the Graphite integration guide for Instructions for how ingest and query flat structured metrics.
Why add complexity to a Prometheus deployment
While Prometheus is a great out of the box monitoring solution, leveraging the M3 platform in addition enhances your monitoring solution with:
- A long term replicated storage of metrics at custom defined resolutions and retentions.
- A distributed TSDB and index that allows you to query across billions of metrics efficiently.
- A monitoring system that can be deployed and managed using Kubernetes.
- A platform that supports applications using either Prometheus or legacy metric formats with a straight forward migration path.
Additionally, M3 has been battle tested in production for years at Uber, handling one of the largest metric workloads in the world. Lastly, the whole platform is completely open source under the Apache-2.0 licence, so why not get started today.
To learn more about containerized infrastructure and cloud native technologies, consider coming to KubeCon + CloudNativeCon Barcelona, May 20-23 in Barcelona.