
This blog is part of our contributory program, Expert Voices. If you are interested in reaching out to our targetted audience, please get in touch.
Success in today’s digital economy is defined by speed. Companies turn to cloud-native technologies like microservices, containers, and Kubernetes to accelerate innovation, build applications faster and improve performance. However, moving to cloud-native technologies and distributed architectures introduces new challenges around speed, scale, and complexity of data — challenges that traditional monitoring solutions simply weren’t designed to handle.
Observability lets you handle this complexity. The right observability strategy and solution translates into more reliability, better customer experience, and higher team productivity.
There are three pillars of observability that apply no matter the complexity of your environment. The more observable a system is, the quicker we can understand why it’s acting up and fix it — which is critical when meeting service-level indicators (SLIs) and objectives (SLOs) and, ultimately, accelerating business results.
One: Observability starts with data
How do you really know what your services are doing? It all starts with the data.
Use ALL your data to avoid blind spots
The only way to troubleshoot a needle-in-a-haystack unknown failure condition and optimize an application’s behavior is to instrument and collect all the data about your environment at full fidelity and without sampling. This is the only way to guarantee no visibility gaps.
When assessing observability solutions, look for those that don’t sample and also retain all your traces. You can decide which traces you want to keep; as well as populate dashboards, service maps, and trace navigations with meaningful information that will help you monitor and troubleshoot your application.
Leverage open, flexible instrumentation and make it easy for developers to use
Plan on using open, standards-based data collection from day one. This makes it easy to instrument your code and start capturing observability data, freeing up developer time.
OpenTelemetry, which is the second most active CNCF project — will give you the most flexibility in not only how you collect data, but also what cloud solutions you use. Using OpenTelemetry sets you up for success when the time comes to scale and expand monitoring and troubleshooting for ever-increasing distributed microservices — making it easier to integrate with everything in your existing toolchain for code-to-cloud visibility.
Operate at speed and resolution of your new software-defined (or cloud) infrastructure
Different use cases with varying degrees of criticality require different resolutions. The resolution at which you collect data from your monolithic application will most likely not be sufficient as you start to collect data from more dynamic microservices running on ephemeral containers or serverless functions.
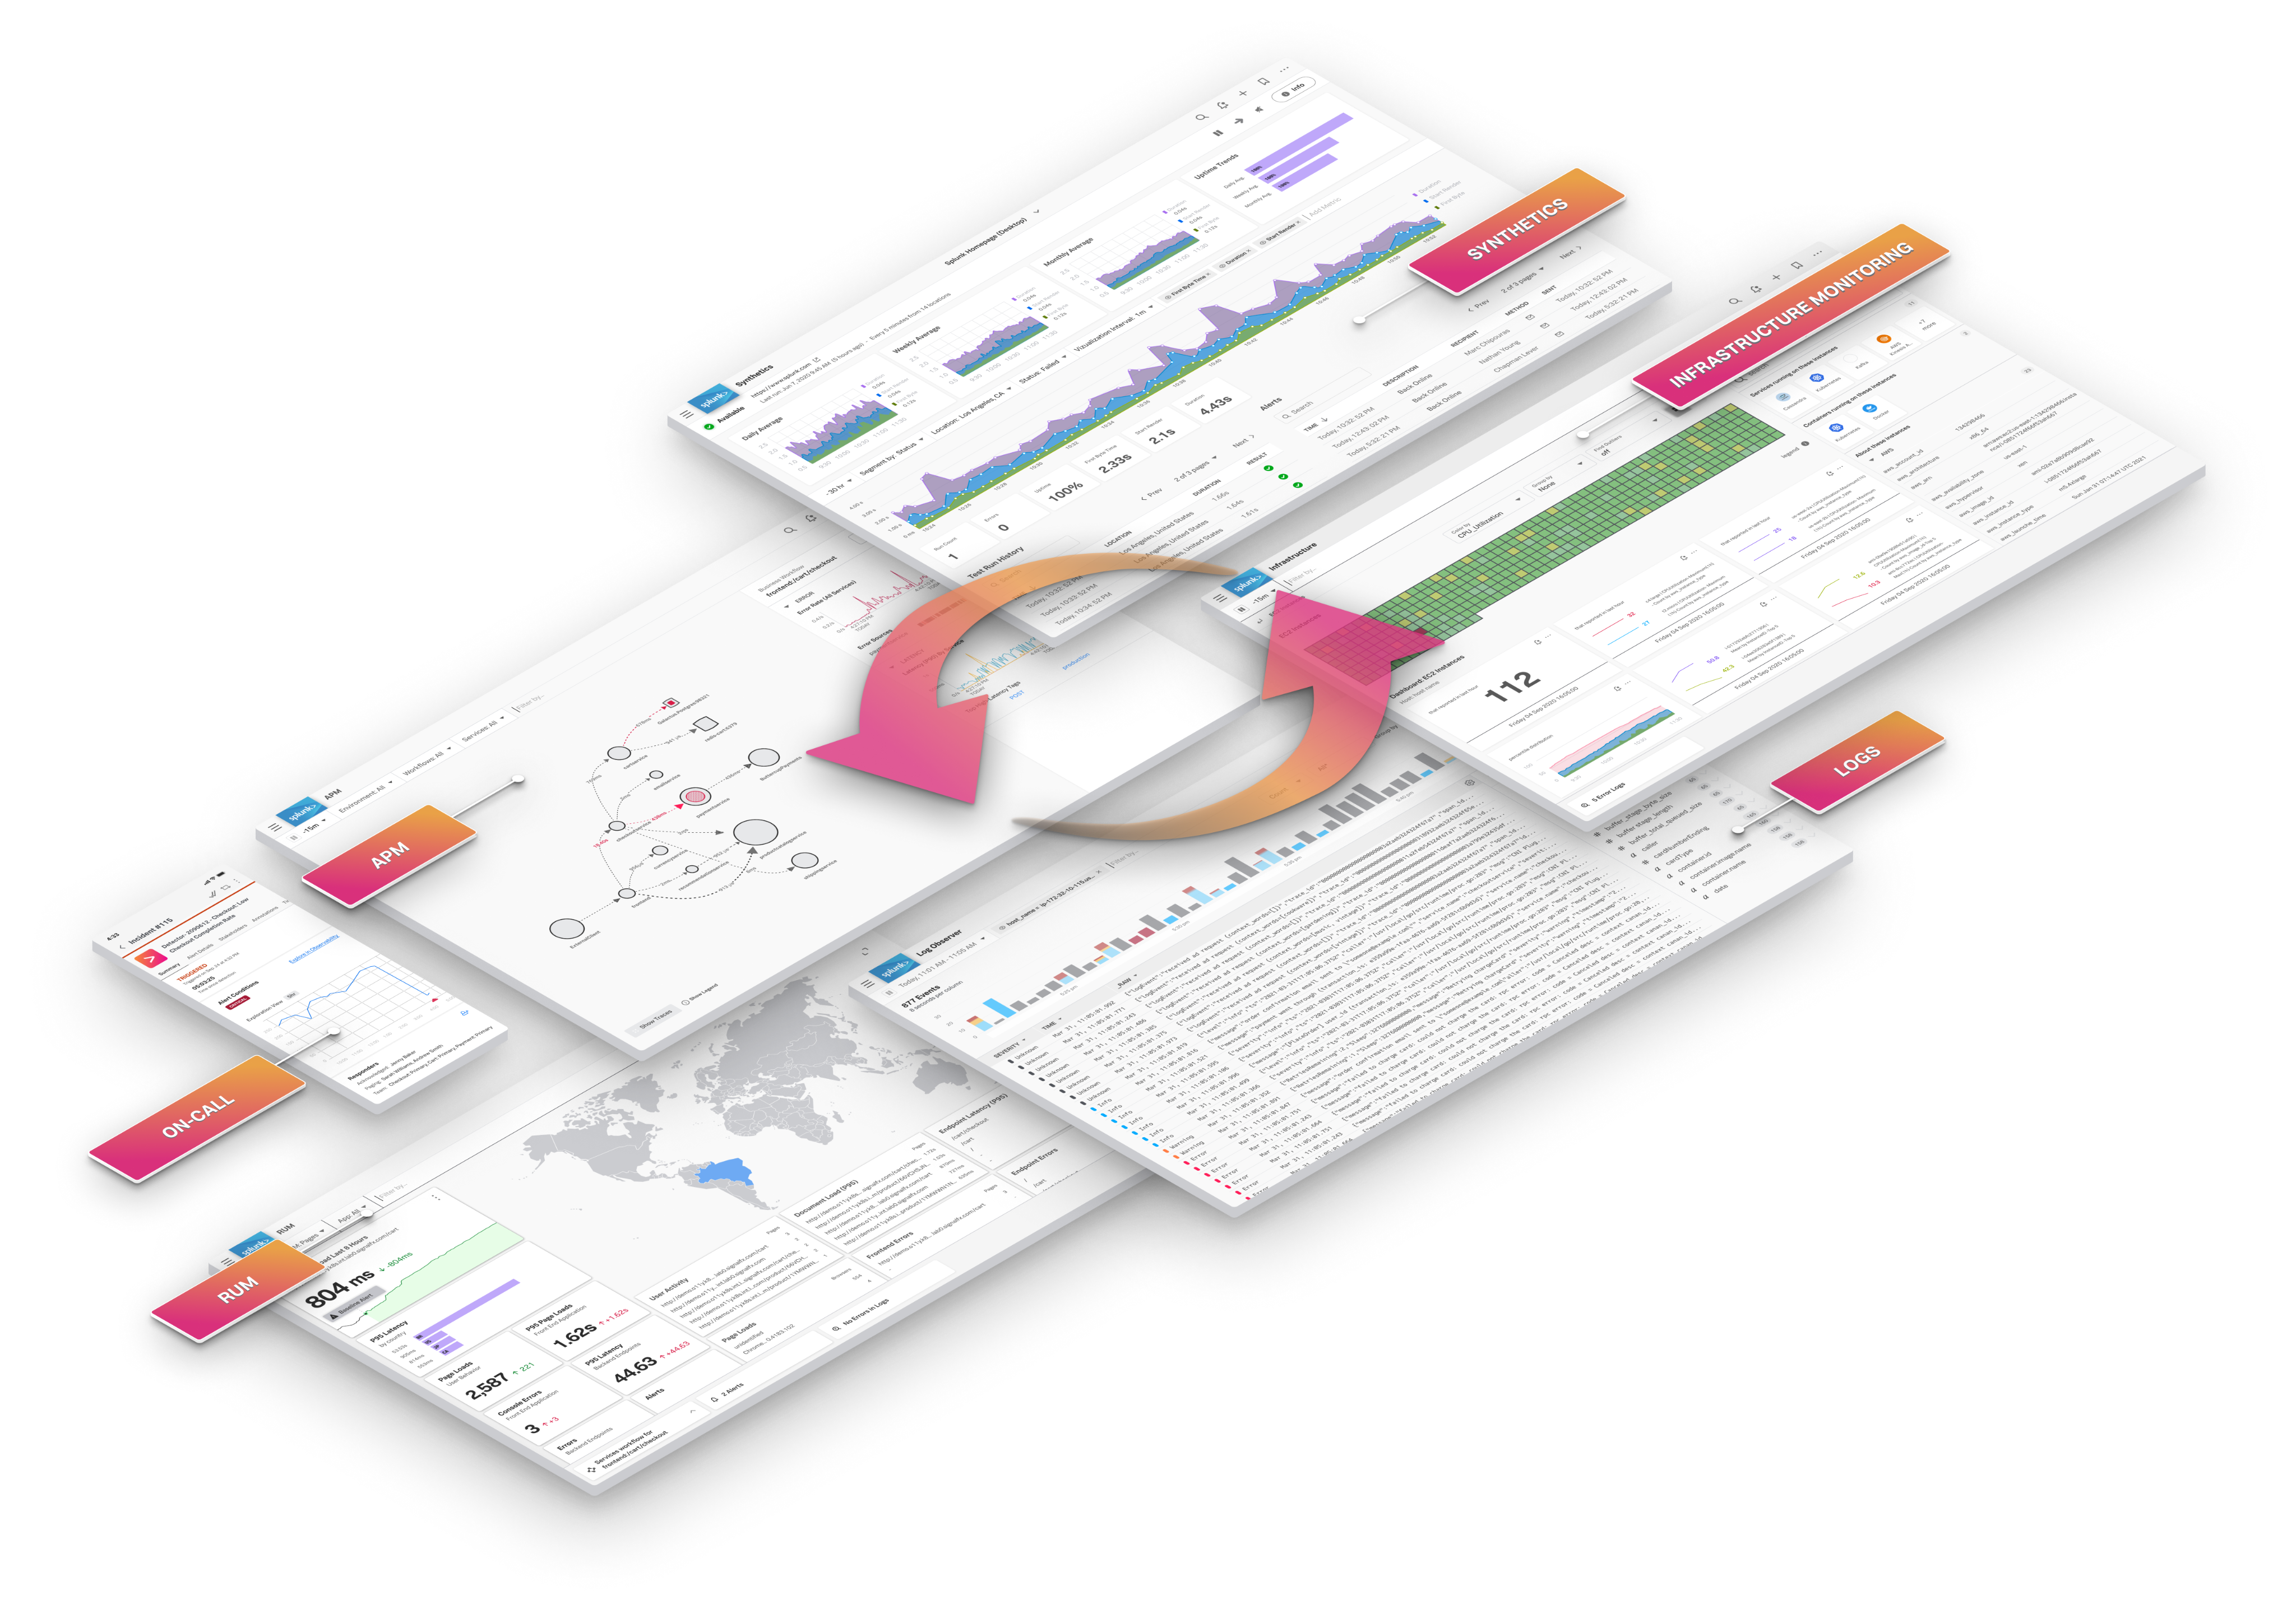
Enable a seamless workflow across monitoring, troubleshooting, and resolution with correlation, and data links between metrics, traces, and logs
Organizations manage multiple point tools — creating silos of data.
This approach isn’t sustainable when trying to resolve issues quickly. Your observability solution should have all capabilities fully integrated, providing you with relevant contextual information throughout your troubleshooting workflow, regardless of your title. Go anywhere the data takes you.
Two: Observability gets us to answers fast
With modern architectures comes a surge of data that impacts your understanding of your systems. But data alone is not meaningful; you need to be able to aggregate it, analyze it and respond to it as needed.
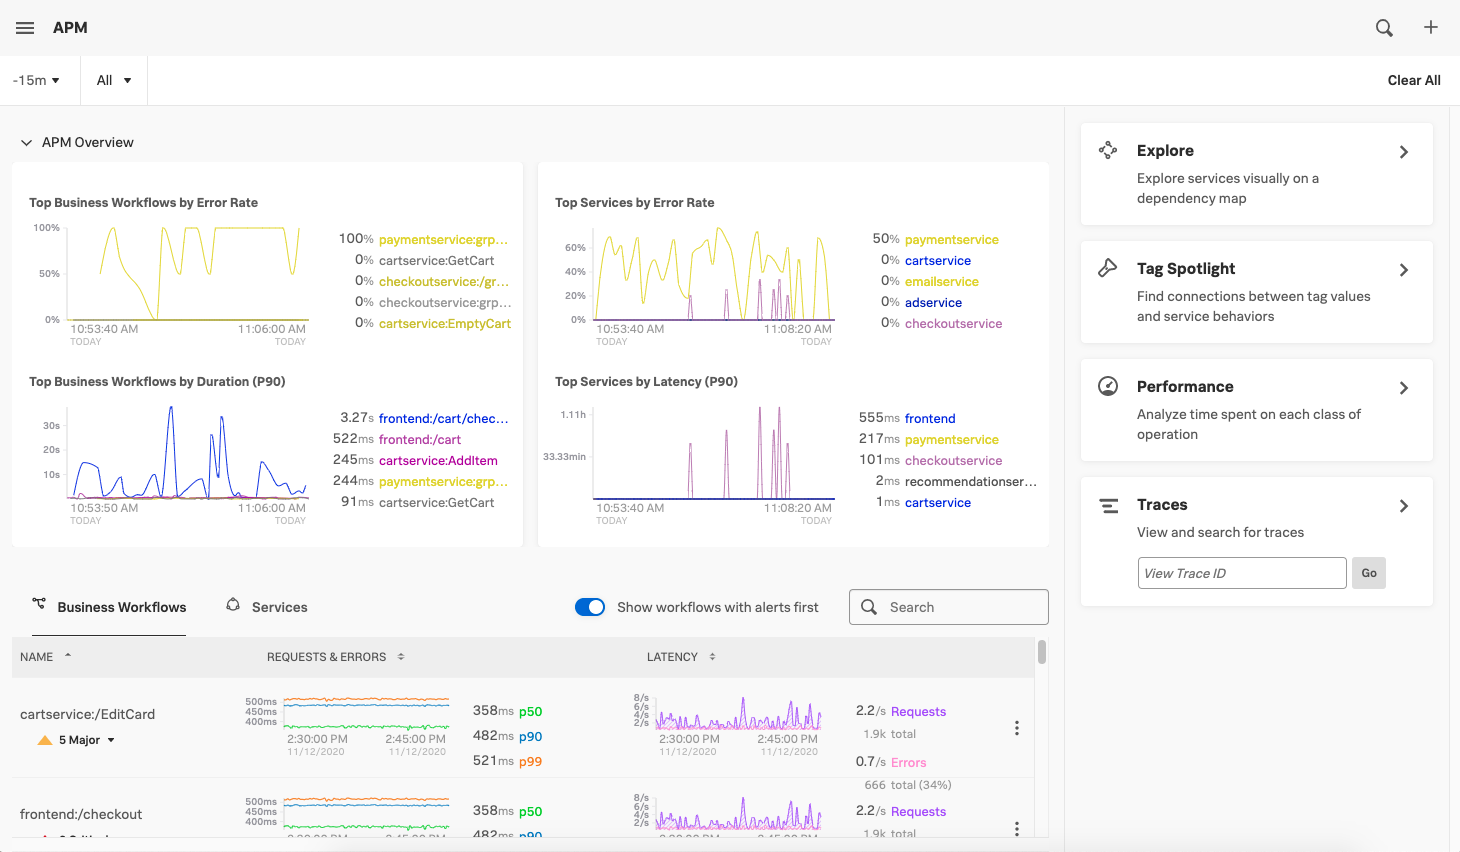
Makes it easy to use, visualize and explore data out of the box
Intuitive visualizations that require no configuration, like dashboards, charts, and heat maps, make it easy to understand the enormous amounts of data your systems produce at a glance, and lets you interact with key metrics in real-time. Make sure your observability solution aggregates all data and automatically displays metrics dashboards, service maps, and container architectures out of the box and allows for dynamic dimension-based filtering, grouping and aggregation. Your solution should also allow custom dashboards that can help keep an eye on particular services of interest.
Your observability tool should make it this easy — one alert, two dashboards, and three clicks to narrow down the source of the problem.
Leverage in-stream AI for faster and more accurate alerting, directed troubleshooting and fast insights
Cloud-native environments produce too much data to make sense of manually. To quickly process all this data, you need real-time analytics to surface relevant patterns and proactively deliver actionable insights. Basic alert triggers based on static thresholds and heartbeat checks are often poorly tuned and noisy, causing floods of alerts that frustrate on-call engineers. Instead of continuing to rely on these ineffective alert types, consider more dynamic thresholds based on statistics or ML, as well as more complex, multi-condition rules. Look for solutions that are effective at baselining historical performance, performing sophisticated comparisons, and detecting outliers and anomalies in real-time. They should also be able to tune and customize your alert rules to your specific application environment.

Give fast feedback about (code) changes, even in production
Observability starts during development.
Once code is deployed, teams need to understand what is happening within their applications as each release flows down the delivery pipeline. You can’t understand your pipeline, or correlate pipeline events with application performance (and end-user experience), if you don’t understand what is happening inside your application.
This is where application testing and performance management come in to deliver code-to-cloud visibility. Observability systems deliver synthetic monitoring, analysis of real-user transactions, log analytics, and metrics tracking, so teams can understand the state of their code from development through deployment. This understanding offers the depth that teams need to gain visibility into the state of each release across the development life cycle.
Smarter monitoring through observability-as-code
Dramatically improve the productivity, efficiency, and predictability of your organization by leveraging programmability wherever possible. In the “everything as code” movement, observability is no exception. The idea behind “observability as code” is that you develop, deploy, test, and share observability assets such as detectors, alerts, dashboards, etc. as code.
Doing so keeps visualizations and alerts current, prevents sprawl, and allows you to maintain version control through a centralized repository, all without having to continuously manage each component manually. Leveraging available APIs and programmability also helps ensure that visualizations and alerts are consistent with best practices and enterprise policies throughout your organization.
Three: Observability is critical to your culture and business strategy
Observability is a critical business investment, especially when seconds of downtime can cost millions of dollars. It extends past DevOps teams to support resiliency and flawless customer experiences.
Observability is a core part of business performance measurement
Observability provides a full view of every layer of the stack, as well as beyond, giving insight to user experience, SLX performance, and other key business metrics. In cloud-native environments, what seem like small changes can have outsized effects.
It’s important to understand the KPIs by which your business is measured and how the teams within your organization will consume the data. You’ll be able to:
- Anticipate what dimensions your monitoring data needs to have.
- Correlate data throughout your stack — from the underlying infrastructure to your applications and microservices.
- Correlate data across your entire digital business.
Provides observability as a service
To avoid decentralization, fragmented data, sky-rocketing cloud costs, and inefficiency, modern observability platforms should provide centralized management so teams and users have access controls and can gain transparency and control overconsumption. Implementing clear best practices for observability across your business can not only cultivate a better developer experience, empowering them to work more efficiently, and focus on building new features — it allows for improved cross-team collaboration, cost assessment, and overall business performance.
Seamlessly embeds collaboration, knowledge management, and incident response
While incidents may be inevitable, a strong observability solution can reduce downtime and, perhaps, prevent it entirely — saving businesses money and improving the quality of life for on-call engineers. To respond to and resolve issues quickly (especially in a high-velocity deployment environment), you’ll need tools that facilitate efficient collaboration and speedy notification. Observability solutions should include automated incident response capabilities to engage the right expert to the right issue at the right time, all to significantly reduce downtime.
Scales to support future growth and elasticity
Invest based on your future observability needs rather than your current ones. How many containers do you have? What about the number of hosts in your environment, applications in production, and code pushes per day? Per year? Answer these questions and you’ll realize why you need a scalable system. To meet the needs of any environment — no matter how large or complex — observability solutions should be able to ingest petabytes of log data and millions of metrics and traces, all while maintaining high performance. This ensures that your investments are future-proof.
This article was adapted from the Splunk White Paper “The 12 Immutable Rules for Observability.” For more best practices and examples download the white paper here. You can also join our four-part “12 Immutable Rules” webinar series on-demand. Register now.
Authored by: Dave McAllister, Sr. Tech Evangelist and Nicolette Graham, Observability PMM at Splunk
Join the cloud native community at KubeCon + CloudNativeCon Europe 2021 – Virtual from May 4-7 to further the education and advancement of cloud native computing.